One of the most interesting aspects of digital projects for me has been examining the different choices in how historians have grouped information and what different scales they’ve used to create their data sets. Over the course of the semester we’ve heard success stories and cautionary tales from the use of “big data.” Historians have had mixed results by examining history on a macroscopic scale but there seem to be many successful projects that have examined history on a microscopic or even regional scale. I think it would be interesting to visualize these different digital projects and see what the “successful” scope of actual data analysis would be for those interested in publishing digital projects. This could be accomplished in many different ways but I would plan to actually visualize two different trends in digital historiography.
First, I would examine digital projects that had been reviewed or had been awarded some sort of accolade for its research. I would then attempt to map the geographical area that the study covered to see what scale of study was most often used by historians. It would look something like this:

If possible, I think this information could also be taken a step further and could be plotted chronologically as well. Through a timeline visualization, we could examine how technological changes and a growing digitized world allowed historians to access a variety of different sources on a larger scale than ever before and how this changed the scope of their research.
Second, I would then examine reviews like the AHR Digital Exchanges and see what the common concerns were. I would then attempt to plot the data through a sort of topic modeling like Word Clouds to see how common the concerns of reviewers were throughout these projects. This could be broken up according to micro or macro histories if necessary since many word cloud models have limits to what they can process. As an example, here is a WordCloud I generated using one of my annotated bibliographies from another class.
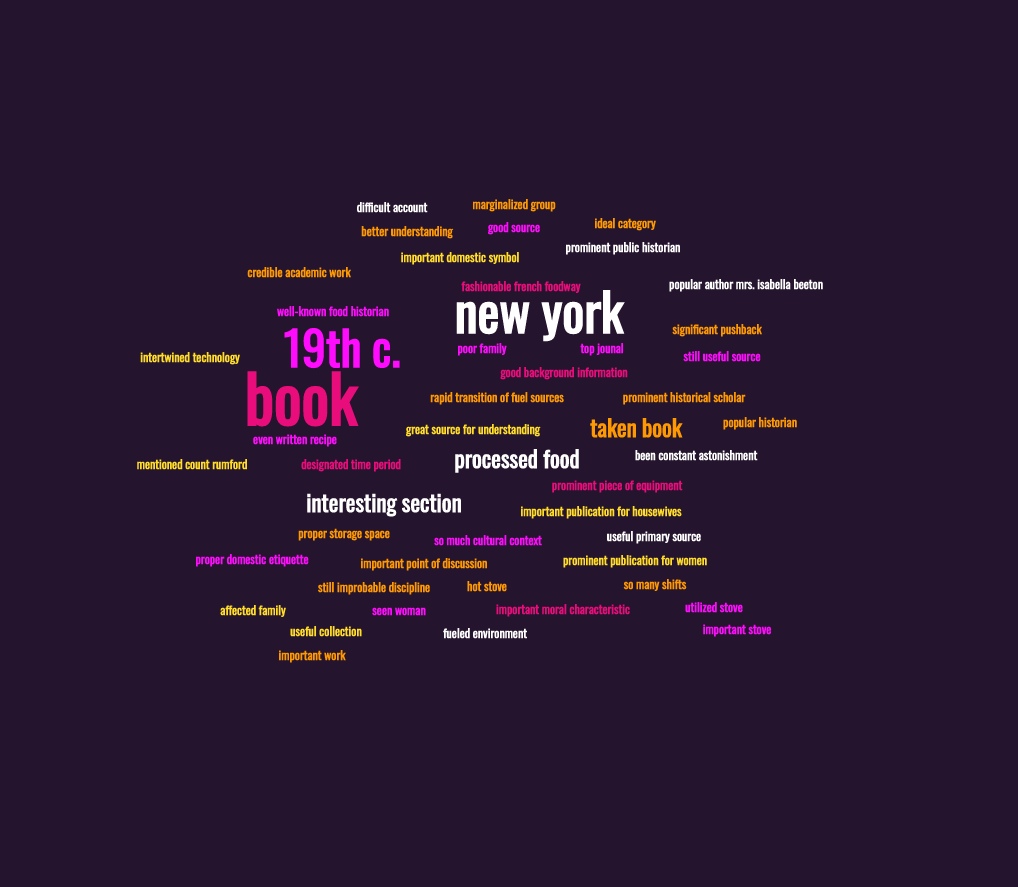
Although the idea of quantitatively mapping the qualitative concerns of reviewers may seem reductive, I have noticed patterns across the readings we have done this semester and the projects we have looked at. I think that understanding how people feel about digital scholarship can be shown by looking at how often certain topics within these reviews are mentioned. Through this examination of the digital historiographical landscape we can see how historians have utilized the ever-changing digital world and how changes in technology and the ethics of digital scholarship have changed over the decades.

Leave a comment